Frontend Performance Engineering: Advanced Guide for Frontend Engineers
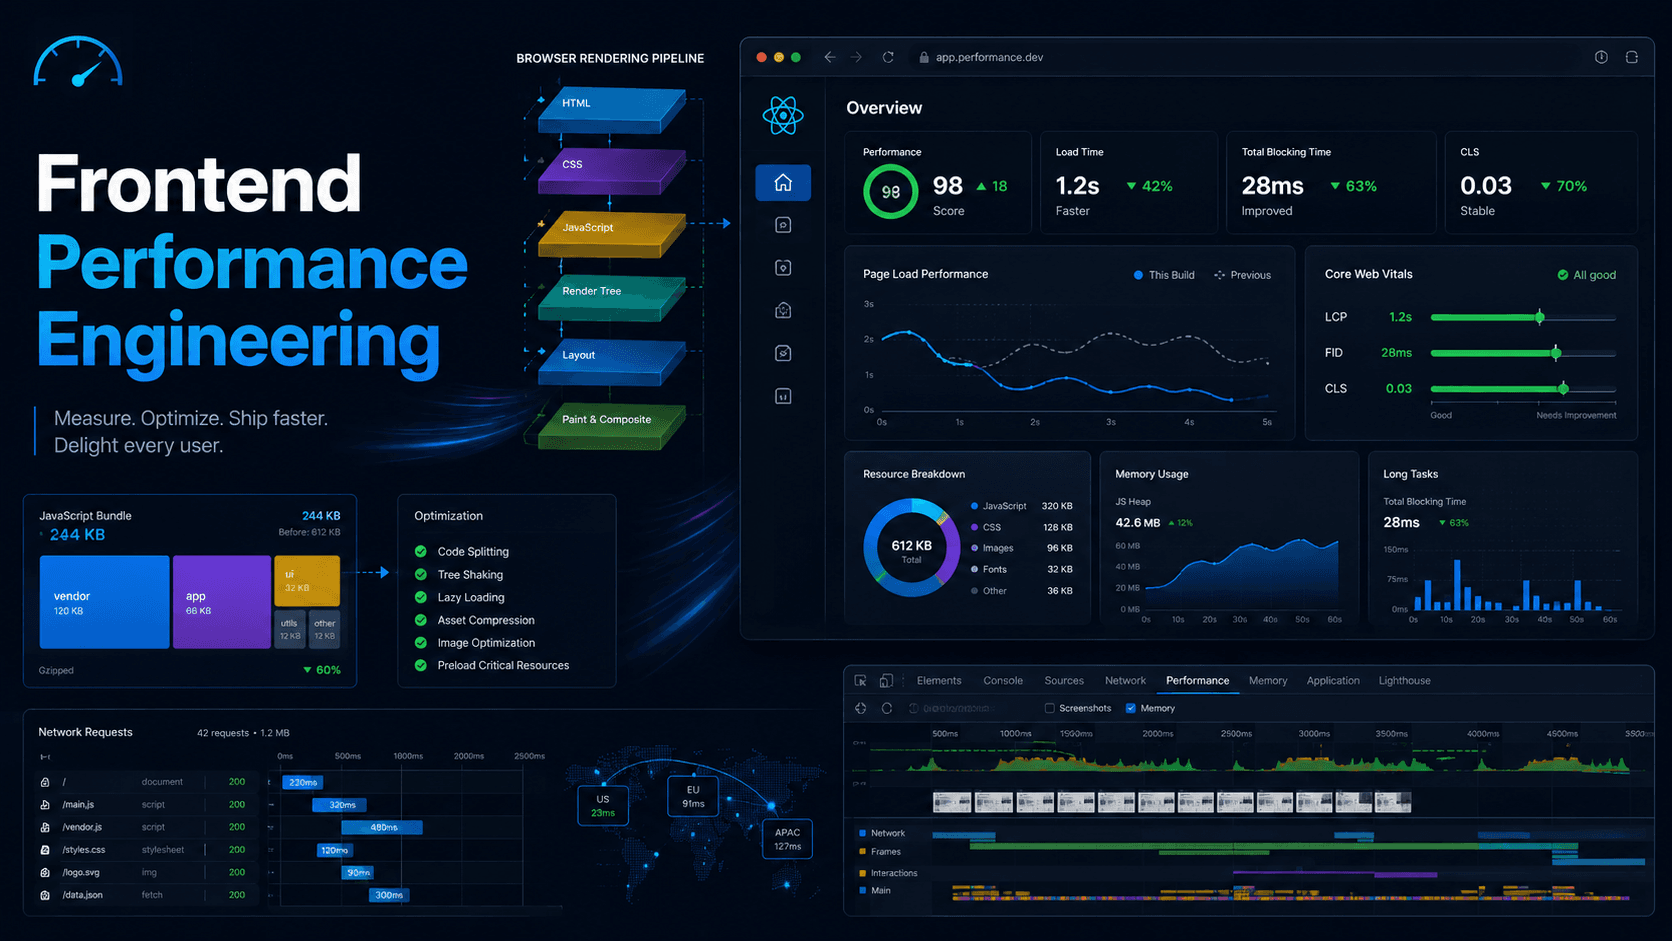
Frontend performance engineering is the skill of making web applications load faster, respond faster, render smoothly, use less memory, and stay reliable for real users across different devices and networks.
This is one of the areas where the difference between a frontend developer and a frontend engineer becomes clear.
A frontend developer can build UI from requirements. A frontend engineer understands how browsers, JavaScript, rendering, networking, caching, memory, and user experience metrics work together. Performance engineering is not only about making Lighthouse green. It is about understanding the actual bottleneck, fixing the right thing, and proving the improvement with measurement.
Mental Model Of Frontend Performance
Frontend performance usually depends on five major areas:
- Network: how fast HTML, CSS, JavaScript, images, fonts, and API data are downloaded.
- JavaScript: how much JavaScript is parsed, compiled, executed, and hydrated.
- Rendering: how efficiently the browser calculates style, layout, paint, and composition.
- Memory: how much memory the page uses and whether unused objects are released.
- User experience metrics: whether the user sees content quickly, can interact quickly, and does not experience layout jumps.
The browser roughly does this work:
Request HTML -> Parse HTML -> Discover CSS/JS/assets -> Download assets -> Build DOM/CSSOM -> Execute JS -> Render -> Handle user interactions
Performance engineering means improving this pipeline without damaging correctness, maintainability, accessibility, or business requirements.
1. Bundle Size Optimization
Bundle size optimization means reducing the amount of JavaScript, CSS, and other frontend assets that users need to download, parse, compile, and execute.
Large bundles are expensive because they affect multiple stages:
- Download time increases, especially on slow networks.
- JavaScript parse and compile time increases.
- Main thread gets blocked for longer.
- Hydration becomes slower in React apps.
- Initial page interaction becomes delayed.
- Mobile devices suffer more than powerful desktop machines.
Tree Shaking
Tree shaking removes unused exports from the final JavaScript bundle.
Example:
// utils.js
export function formatPrice(value) {
  return `$${value.toFixed(2)}`;
}

export function heavyAnalyticsHelper() {
  // large unused logic
}


import { formatPrice } from './utils';

console.log(formatPrice(20));
If the bundler supports tree shaking, heavyAnalyticsHelper should not be included in the production bundle.
Tree shaking works best when:
- You use ES modules: import and export.
- Dependencies are side-effect free.
- The package correctly defines sideEffects in package.json.
- You avoid importing entire libraries when you only need a small function.
// Bad example:

import _ from 'lodash';


// Better example:

import debounce from 'lodash/debounce';
Or use a smaller native alternative when possible.
Code Splitting
Code splitting means breaking one large JavaScript bundle into smaller chunks that can be loaded when needed.
Without code splitting, a user may download code for every page, even if they only visit the home page.
Example:
Before:
main.js = home + dashboard + settings + admin + chart library

After:
main.js = shared app code
dashboard.js = dashboard only
settings.js = settings only
admin.js = admin only
Common splitting strategies:
- Route-based splitting: load code based on the page route.
- Component-based splitting: load expensive components only when needed.
- Library splitting: separate large dependencies like charting libraries or editors.
- Interaction-based splitting: load code after user action.
Dynamic Import
Dynamic import allows JavaScript modules to be loaded asynchronously.
async function openChart() {
  const { ChartPanel } = await import('./ChartPanel');
  renderChartPanel(ChartPanel);
}


// In React:

import { lazy, Suspense } from 'react';

const SettingsPage = lazy(() => import('./SettingsPage'));

export function App() {
  return (
    <Suspense fallback={<p>Loading settings...</p>}>
      <SettingsPage />
    </Suspense>
  );
}
Dynamic import is useful for:
- Modals that are not always opened.
- Admin-only screens.
- Heavy chart components.
- Markdown editors.
- Map libraries.
- Video players.
Lazy Loading
Lazy loading means delaying the loading of something until it is actually needed.
You can lazy load:
- JavaScript components.
- Images.
- Videos.
- Routes.
- Data.
- Third-party widgets.
Image lazy loading:

<img src="product.jpg" loading="lazy" alt="Product" />
Important rule: do not lazy load the most important above-the-fold content. For example, lazy loading the LCP hero image can make LCP worse.
Bundle Analysis
Bundle analysis helps you understand what is inside your production bundle.
Useful tools:
- webpack-bundle-analyzer
- rollup-plugin-visualizer
- vite-bundle-visualizer
- source-map-explorer
- Chrome DevTools Coverage tab
You should look for:
- Large dependencies.
- Duplicate dependencies.
- Unused code.
- Large vendor chunks.
- Unexpected packages.
- Heavy polyfills.
- Accidentally bundled server-only code.
Questions to ask during bundle analysis:
- Is this dependency really needed?
- Can this feature be loaded later?
- Can this package be replaced with a smaller one?
- Are we importing the whole library for one function?
- Is this code used by all users or only a small group?
Webpack Optimization
Webpack performance optimization commonly includes:
- Use production mode.
- Enable minification.
- Use splitChunks for vendor and shared chunks.
- Use deterministic module IDs for long-term caching.
- Use tree-shakeable ES module imports.
- Avoid unnecessary polyfills.
- Use asset compression.
- Analyze bundle output regularly.
Example:
module.exports = {
  mode: 'production',
  optimization: {
    splitChunks: {
      chunks: 'all',
    },
    runtimeChunk: 'single',
  },
};
Vite Optimization
Vite is fast because it uses native ES modules during development and Rollup for production builds.
Common Vite optimization techniques:
- Use dynamic imports for route-level splitting.
- Use manualChunks carefully for large libraries.
- Analyze production output with Rollup visualizer.
- Avoid importing huge dependencies globally.
- Keep dependencies ESM-friendly.
- Use modern browser targets when legacy browser support is not required.
Example:
export default {
  build: {
    rollupOptions: {
      output: {
        manualChunks: {
          vendor: ['react', 'react-dom'],
        },
      },
    },
  },
};
Do not overuse manual chunking. Too many chunks can create unnecessary request overhead and cache complexity.
Common Bundle Optimization Mistakes
- Optimizing without measuring first.
- Splitting code into too many tiny chunks.
- Lazy loading critical content.
- Importing full libraries for small utilities.
- Ignoring CSS size.
- Forgetting that JavaScript execution cost matters more than download size on slow devices.
- Relying only on gzip size while ignoring parsed and executed JavaScript.
Bundle Optimization Checklist
- Analyze the production bundle.
- Remove unused dependencies.
- Replace heavy packages when possible.
- Split routes and heavy components.
- Lazy load non-critical features.
- Keep critical path JavaScript small.
- Use modern ESM imports.
- Monitor bundle size in CI.
- Define a performance budget.
Interview Questions And Answers: Bundle Size Optimization
Question: What is tree shaking?
Tree shaking is the process of removing unused code from the final bundle. It works best with ES modules because static imports and exports allow bundlers to understand which code is used.
Question: Why can a large JavaScript bundle hurt performance even after compression?
Compression reduces download size, but the browser still needs to decompress, parse, compile, and execute the JavaScript. On mobile devices, JavaScript execution can be more expensive than downloading.
Question: What is code splitting?
Code splitting breaks a large bundle into smaller chunks so users only download the code needed for the current route or feature.
Question: When should you use dynamic import?
Use dynamic import for code that is not needed immediately, such as admin screens, modals, chart libraries, editors, or route-specific components.
Question: Can code splitting make performance worse?
Yes. If you create too many small chunks, the browser may need many requests and dependency waterfalls. Code splitting should be based on real usage patterns.
Question: How do you investigate bundle size problems?
Build the production app, run a bundle analyzer, identify large or duplicate dependencies, check unused code, inspect route chunks, and compare the result against a performance budget.
2. Rendering Performance
Rendering performance is about how efficiently the browser and framework update what the user sees.
Poor rendering performance can cause:
- Slow interactions.
- Janky scrolling.
- Delayed typing.
- Frozen UI.
- High CPU usage.
- Poor INP score.
Browser Rendering Pipeline
The browser rendering pipeline usually includes:
JavaScript -> Style calculation -> Layout -> Paint -> Composite
JavaScript can update the DOM or state. Then the browser may recalculate styles, calculate element positions, paint pixels, and composite layers.
Expensive operations include:
- Reading and writing layout repeatedly.
- Animating layout properties like width, height, top, or left.
- Rendering very large lists.
- Updating too many DOM nodes.
- Running heavy JavaScript on every interaction.
Better animation properties:
.box {
  transform: translateX(100px);
  opacity: 0.8;
}


Usually avoid animating:

.box {
  left: 100px;
  width: 300px;
}
Re-render Analysis In React
In React, a re-render means React calls your component function again to calculate the next UI tree.
A re-render is not automatically bad. It becomes a problem when:
- It happens too often.
- The component does expensive calculation during render.
- A large subtree re-renders unnecessarily.
- A list has many complex items.
- The re-render causes expensive DOM updates.
Common causes of re-render:
- State update in the component.
- Parent component re-render.
- Context value change.
- Props identity changes.
- External store updates.
Tools for analysis:
- React DevTools Profiler.
- Chrome Performance panel.
- why-did-you-render for debugging.
- Console logging during development, used carefully.
React.memo
React.memo memoizes a component result based on props.
const ProductCard = React.memo(function ProductCard({ product }) {
  return <div>{product.name}</div>;
});
It can help when:
- The component is expensive to render.
- Props are stable.
- Parent re-renders often.
- The child does not need to update every time.
It may not help when:
- Props change every render.
- The component is cheap.
- You pass new object or function references every time.
- The comparison cost is higher than the render cost.
useMemo
useMemo caches the result of a calculation between renders.
const filteredProducts = useMemo(() => {
  return products.filter((product) => product.category === selectedCategory);
}, [products, selectedCategory]);
It can help when:
- The calculation is expensive.
- The dependencies do not change often.
- The value is passed to a memoized child.
It should not be used for every calculation. Memoization has overhead and makes code more complex.
useCallback
useCallback caches a function reference between renders.
const handleSelect = useCallback((id) => {
  setSelectedId(id);
}, []);
It can help when:
- The callback is passed to a memoized child.
- The callback is used as a dependency in another hook.
- Stable function identity matters.
It does not prevent the function from being created in all possible practical senses that matter to beginners. Its main purpose is stable identity, not making functions magically free.
React 19, React Compiler, useMemo, And useCallback
In React 19, the important discussion is React Compiler. React Compiler can automatically memoize values and functions in many cases, reducing the need for manual useMemo, useCallback, and sometimes React.memo.
So, are useMemo and useCallback still needed?
The practical answer is: less often, but not completely gone.
You still need to understand them because:
- Many production projects are still on React 17 or React 18.
- Not every React 19 app has React Compiler enabled.
- The compiler may not be available or configured in every framework setup.
- Some code patterns may not be safely optimizable by the compiler.
- Library authors still care about stable references and memoization behavior.
- Interviews still ask these concepts because they test rendering knowledge.
In a React 19 project with React Compiler enabled, you should avoid adding manual useMemo and useCallback by default. Write clear code first. Measure performance. Add manual memoization only when there is a proven reason or when the compiler cannot handle the case.
Old habit:
const handleClick = useCallback(() => {
  setOpen(true);
}, []);
Better default in React 19 with compiler:
function handleClick() {
  setOpen(true);
}
Manual memoization may still be useful when:
- You are working without React Compiler.
- You pass values to non-React libraries that depend on reference equality.
- You use a memoized child and the compiler is not covering that path.
- You need stable references for effect dependencies in a specific design.
- Profiling proves that recalculation or unstable references are causing a real issue.
Senior engineer rule: do not optimize React renders by habit. Profile first, understand the cause, then choose the smallest fix.
Virtualization And Windowing
Virtualization means rendering only the visible part of a large list instead of rendering every item.
Example problem:
{items.map((item) => (
  <ProductRow key={item.id} item={item} />
))}
If items has 50,000 rows, rendering all rows will be expensive.
Virtualization renders only what is visible:
Visible rows: 30
Total data rows: 50,000
DOM rows rendered: around 30 to 60
Popular libraries:
- react-window
- react-virtualized
- @tanstack/react-virtual
Virtualization is useful for:
- Data tables.
- Chat lists.
- Search results.
- Logs.
- Infinite scrolling.
Tradeoffs:
- More complex accessibility.
- Dynamic row heights can be harder.
- Browser find may not find non-rendered content.
- Scroll restoration can be more complex.
Concurrent Features
React concurrent features help keep the UI responsive by allowing React to interrupt, prioritize, or defer rendering work.
Useful APIs:
- startTransition
- useTransition
- useDeferredValue
Example with startTransition:
import { startTransition, useState } from 'react';

function SearchPage({ items }) {
  const [query, setQuery] = useState('');
  const [filteredItems, setFilteredItems] = useState(items);

  function handleChange(event) {
    const nextQuery = event.target.value;
    setQuery(nextQuery);

    startTransition(() => {
      setFilteredItems(
        items.filter((item) => item.name.includes(nextQuery))
      );
    });
  }

  return <input value={query} onChange={handleChange} />;
}
The input update is urgent. The list filtering update can be less urgent.
useDeferredValue is useful when a value can lag behind slightly while the urgent UI remains responsive.
Concurrent features do not make expensive work disappear. They help scheduling. If the calculation is truly heavy, you may still need virtualization, debouncing, server-side filtering, or a Web Worker.
Rendering Performance Checklist
- Use React Profiler before optimizing.
- Avoid expensive calculations during render.
- Keep state close to where it is needed.
- Avoid unnecessary context updates.
- Use virtualization for large lists.
- Use CSS transforms and opacity for animations.
- Avoid layout thrashing.
- Use React 19 compiler-friendly patterns where available.
- Avoid manual memoization by default in React 19 compiler-enabled apps.
- Use React.memo, useMemo, and useCallback only when they solve a measured issue.
Interview Questions And Answers: Rendering Performance
Question: Is every React re-render bad?
No. Re-rendering is normal. It becomes a problem when it is frequent, expensive, affects a large subtree, or causes slow interactions.
Question: What does React.memo do?
React.memo prevents a component from re-rendering when its props are equal to the previous props. It is useful for expensive components with stable props.
Question: What is the difference between useMemo and useCallback?
useMemo memoizes a calculated value. useCallback memoizes a function reference. useCallback(fn, deps) is similar to useMemo(() => fn, deps).
Question: Are useMemo and useCallback still needed in React 19?
They are needed less often when React Compiler is enabled because the compiler can automatically memoize many values and functions. But they are still important in projects without the compiler, library code, non-React integrations, and cases where profiling proves manual memoization is needed.
Question: What is virtualization?
Virtualization renders only the visible items in a large list instead of rendering the entire list. It improves rendering speed and memory usage.
Question: What does startTransition do?
startTransition marks a state update as non-urgent, allowing React to prioritize urgent updates like typing or clicking.
3. Memory Management
Memory management in frontend means ensuring the browser can release objects, DOM nodes, event listeners, timers, requests, and subscriptions that are no longer needed.
Memory problems often appear as:
- The app becomes slower over time.
- Memory usage keeps increasing.
- The tab crashes.
- Old data appears unexpectedly.
- Event handlers run multiple times.
- CPU usage increases after navigation.
Garbage Collection Basics
JavaScript uses automatic garbage collection. The engine removes objects that are no longer reachable.
Example:
let user = { name: 'Asha' };
user = null;
If nothing else references the object, it can be garbage collected.
But garbage collection cannot clean objects that are still reachable through references.
Common references that keep memory alive:
- Global variables.
- Closures.
- Event listeners.
- Timers.
- Detached DOM nodes.
- Caches.
- Unfinished network requests.
- Subscriptions.
Memory Leaks
A memory leak happens when memory that is no longer needed remains referenced and cannot be garbage collected.
Example leak with timer:
useEffect(() => {
  const intervalId = setInterval(() => {
    console.log('running');
  }, 1000);
}, []);


Fixed:

useEffect(() => {
  const intervalId = setInterval(() => {
    console.log('running');
  }, 1000);

  return () => {
    clearInterval(intervalId);
  };
}, []);
Detached DOM Nodes
A detached DOM node is a DOM node removed from the document but still referenced by JavaScript.
Example:
let cachedNode = document.querySelector('#modal');
document.body.removeChild(cachedNode);
The node is removed visually, but cachedNode still references it. The browser cannot free it.
This can happen with:
- Manual DOM manipulation.
- Third-party widgets.
- Portals.
- Old references stored in arrays or maps.
- Event listeners attached to removed elements.
Event Listener Cleanup
If you add an event listener manually, remove it when the component unmounts.
useEffect(() => {
  function handleResize() {
    console.log(window.innerWidth);
  }

  window.addEventListener('resize', handleResize);

  return () => {
    window.removeEventListener('resize', handleResize);
  };
}, []);


Avoid this mistake:

useEffect(() => {
  window.addEventListener('resize', () => {
    console.log(window.innerWidth);
  });
}, []);
You cannot remove the anonymous function later because you do not have the same function reference.
AbortController
AbortController cancels fetch requests that are no longer needed.
useEffect(() => {
  const controller = new AbortController();

  async function loadUser() {
    const response = await fetch('/api/user', {
      signal: controller.signal,
    });
    const data = await response.json();
    setUser(data);
  }

  loadUser().catch((error) => {
    if (error.name !== 'AbortError') {
      throw error;
    }
  });

  return () => {
    controller.abort();
  };
}, []);
This prevents unnecessary work and avoids updating state after a component no longer needs the result.
Debugging Memory Leaks
Use Chrome DevTools:
- Memory tab.
- Heap snapshot.
- Allocation timeline.
- Performance monitor.
- Detached elements view.
Debugging workflow:
- Open the page.
- Take a heap snapshot.
- Perform the suspected action multiple times.
- Navigate away or close the component.
- Force garbage collection in DevTools.
- Take another heap snapshot.
- Compare retained objects.
Memory Management Checklist
- Clean up timers and intervals.
- Remove manual event listeners.
- Cancel unnecessary fetch requests.
- Unsubscribe from sockets and external stores.
- Avoid storing large data globally forever.
- Watch for detached DOM nodes.
- Limit client-side caches.
- Test long sessions, not only initial load.
Interview Questions And Answers: Memory Management
Question: What is a memory leak in JavaScript?
A memory leak happens when unused objects are still reachable through references, so the garbage collector cannot remove them.
Question: What are detached DOM nodes?
Detached DOM nodes are nodes removed from the document but still referenced by JavaScript, preventing garbage collection.
Question: Why should event listeners be cleaned up?
If listeners remain after a component unmounts, they can keep references alive and cause duplicate handlers, memory leaks, or unexpected behavior.
Question: What is AbortController used for?
AbortController cancels ongoing requests, usually when a component unmounts or a newer request replaces an older one.
Question: How do you detect memory leaks?
Use Chrome DevTools Memory tools, take heap snapshots before and after repeated actions, force garbage collection, and inspect retained objects or detached nodes.
4. Network Performance
Network performance is about reducing latency, transfer size, request waterfalls, and unnecessary network work.
Even a perfectly optimized React app can feel slow if the network strategy is poor.
HTTP/1 vs HTTP/2 vs HTTP/3
HTTP/1.1:
- Limited parallel requests per origin.
- Multiple connections are often needed.
- Head-of-line blocking can happen at the request level.
- Too many small files can be inefficient.
HTTP/2:
- Multiplexes many requests over one connection.
- Reduces connection overhead.
- Better for many assets.
- Still uses TCP, so TCP-level head-of-line blocking can happen.
HTTP/3:
- Uses QUIC over UDP.
- Reduces connection setup time.
- Improves behavior on unreliable networks.
- Avoids some TCP head-of-line blocking issues.
Frontend impact:
- With HTTP/2 and HTTP/3, many small chunks are less harmful than HTTP/1, but dependency waterfalls still matter.
- Critical resources should still be prioritized.
- Connection setup and server latency still affect performance.
Compression
Compression reduces transfer size.
Common compression formats:
- Gzip
- Brotli
Brotli usually compresses text assets better than gzip.
Compress:
- HTML
- CSS
- JavaScript
- JSON
- SVG
Usually do not compress already compressed formats:
- JPEG
- PNG
- WebP
- AVIF
- MP4
- WOFF2
CDN
A CDN stores assets closer to users geographically.
Benefits:
- Lower latency.
- Faster static asset delivery.
- Reduced origin server load.
- Better global availability.
- Edge caching.
Common CDN strategy:
- Cache static assets with long expiry.
- Use hashed filenames for cache busting.
- Cache HTML carefully because it changes more often.
- Serve images through an image CDN when possible.
Example:
app.8fd31.js -> cache for 1 year
index.html -> cache for short time or revalidate
Browser Cache
Browser caching avoids downloading the same resource repeatedly.
Important headers:
Cache-Control: max-age=31536000, immutable
Cache-Control: no-cache
Cache-Control: stale-while-revalidate=86400
Good strategy:
- Hashed static files: long cache.
- HTML: short cache or revalidation.
- API data: depends on freshness requirements.
- Fonts: long cache.
- Images: long cache when filenames are versioned.
Service Workers
Service workers run in the background and can intercept network requests.
They can be used for:
- Offline support.
- Asset caching.
- App shell caching.
- Background sync.
- Push notifications.
- Faster repeat visits.
Common caching strategies:
- Cache first: good for static assets.
- Network first: good for fresh data.
- Stale while revalidate: return cached data quickly and update in background.
Service workers are powerful but risky. A bad service worker can serve stale or broken assets. Always design update and rollback behavior carefully.
Prefetch, Preload, And Preconnect
preload tells the browser to load a critical resource early.
<link rel="preload" href="/fonts/inter.woff2" as="font" type="font/woff2" crossorigin />Use preload for important resources needed for the current page, such as critical fonts or hero images.
prefetch tells the browser to fetch a resource for likely future navigation.
<link rel="prefetch" href="/dashboard.js" />Use prefetch for resources likely needed soon but not required now.
preconnect starts an early connection to another origin.
<link rel="preconnect" href="https://api.example.com" />Use preconnect for critical third-party origins, but do not overuse it.
API And Data Loading Performance
Frontend network performance is not only static assets. API design matters too.
Common problems:
- Request waterfalls.
- Fetching too much data.
- Fetching the same data repeatedly.
- No caching.
- Slow server response.
- Blocking rendering while waiting for non-critical data.
Better patterns:
- Parallelize independent requests.
- Use pagination.
- Use server-side filtering.
- Cache API responses when safe.
- Avoid duplicate requests.
- Use optimistic UI carefully.
- Stream data when appropriate.
Network Performance Checklist
- Use Brotli or gzip for text assets.
- Serve static assets through a CDN.
- Use hashed filenames and long-term caching.
- Avoid request waterfalls.
- Preload only critical resources.
- Prefetch likely next-route assets.
- Use preconnect for critical external origins.
- Cache API responses appropriately.
- Monitor real network performance by geography and device type.
Interview Questions And Answers: Network Performance
Question: What is the difference between HTTP/1 and HTTP/2?
HTTP/1 has limited parallelism and often needs multiple connections. HTTP/2 supports multiplexing, allowing multiple requests over one connection.
Question: Why is Brotli often better than gzip?
Brotli usually produces smaller compressed text assets, especially for JavaScript, CSS, and HTML.
Question: What is a CDN?
A CDN is a distributed network of servers that delivers assets from locations closer to users, reducing latency and origin load.
Question: What is the difference between preload and prefetch?
Preload is for resources needed for the current page. Prefetch is for resources likely needed in the future.
Question: When can service workers be dangerous?
They can serve stale or broken cached files if update logic is wrong. This can keep users stuck on an old or broken version.
5. Core Web Vitals
Core Web Vitals are user experience metrics used to measure loading speed, visual stability, and interaction responsiveness.
The main Core Web Vitals are:
- LCP: Largest Contentful Paint.
- CLS: Cumulative Layout Shift.
- INP: Interaction to Next Paint.
Other important metrics:
- FCP: First Contentful Paint.
- TTFB: Time to First Byte.
LCP: Largest Contentful Paint
LCP measures when the largest visible content element is rendered.
Common LCP elements:
- Hero image.
- Large heading.
- Banner image.
- Main content block.
Good target:
LCP <= 2.5 seconds
Common causes of poor LCP:
- Slow server response.
- Render-blocking CSS or JavaScript.
- Large unoptimized images.
- Lazy-loaded hero image.
- Client-side rendering delay.
- Slow font loading.
How to improve LCP:
- Improve TTFB.
- Optimize hero image size and format.
- Use fetchpriority="high" for important images.
- Preload critical assets.
- Reduce render-blocking resources.
- Reduce JavaScript needed before rendering main content.
- Use SSR or SSG for important content when appropriate.
Example:
<img src="/hero.avif" width="1200" height="600" fetchpriority="high" alt="Dashboard preview" />CLS: Cumulative Layout Shift
CLS measures unexpected layout movement.
Good target:
CLS <= 0.1
Common causes of poor CLS:
- Images without width and height.
- Ads or embeds without reserved space.
- Fonts swapping and changing layout.
- Injected banners.
- Late-loading content above existing content.
How to improve CLS:
- Set image dimensions.
- Reserve space for ads and embeds.
- Avoid inserting content above existing content.
- Use stable skeleton layouts.
- Optimize font loading.
- Use aspect-ratio for media containers.
Example:
.video-card {
  aspect-ratio: 16 / 9;
  background: #eee;
}
INP: Interaction To Next Paint
INP measures how responsive the page is to user interactions. It replaced FID as a Core Web Vital.
Good target:
INP <= 200 ms
Common causes of poor INP:
- Long JavaScript tasks.
- Expensive event handlers.
- Heavy React re-renders.
- Large DOM updates.
- Blocking third-party scripts.
- Slow input processing.
How to improve INP:
- Break long tasks.
- Reduce JavaScript execution.
- Use virtualization for large lists.
- Avoid unnecessary re-renders.
- Use startTransition for non-urgent updates.
- Move heavy CPU work to Web Workers.
- Debounce expensive operations.
- Optimize third-party scripts.
FCP: First Contentful Paint
FCP measures when the browser first renders any content from the DOM, such as text, image, SVG, or canvas.
Good FCP means users see something quickly.
Common causes of poor FCP:
- Slow server response.
- Large render-blocking CSS.
- Blocking JavaScript.
- Slow font loading.
- Heavy client-side rendering.
How to improve FCP:
- Reduce TTFB.
- Inline critical CSS carefully.
- Defer non-critical JavaScript.
- Use SSR or SSG when useful.
- Optimize font loading.
TTFB: Time To First Byte
TTFB measures how long it takes to receive the first byte from the server.
TTFB includes:
- DNS lookup.
- TCP/TLS connection.
- Server processing.
- Network latency.
- CDN behavior.
Good target:
TTFB <= 800 ms
How to improve TTFB:
- Use CDN caching.
- Optimize server rendering.
- Reduce backend processing time.
- Use edge rendering where appropriate.
- Improve database queries.
- Avoid slow middleware.
- Cache HTML where possible.
Lab Data vs Field Data
Lab data is measured in controlled environments.
Examples:
- Lighthouse.
- Chrome DevTools.
- WebPageTest.
Field data is measured from real users.
Examples:
- Chrome User Experience Report.
- Real User Monitoring.
- web-vitals library.
Lab data is useful for debugging. Field data is useful for understanding real user experience.
Core Web Vitals Checklist
- Optimize LCP element.
- Prevent layout shifts.
- Reduce long tasks.
- Improve server response time.
- Optimize fonts and images.
- Reduce JavaScript execution.
- Monitor field data, not only Lighthouse.
- Test on slower devices and networks.
Interview Questions And Answers: Core Web Vitals
Question: What are Core Web Vitals?
Core Web Vitals are metrics that measure important parts of user experience: loading performance, visual stability, and interaction responsiveness.
Question: What is LCP?
Largest Contentful Paint measures when the largest visible content element is rendered. It indicates how quickly the main content appears.
Question: How do you improve LCP?
Optimize the LCP resource, reduce TTFB, preload critical assets, reduce render-blocking CSS and JavaScript, and avoid lazy loading the hero content.
Question: What is CLS?
Cumulative Layout Shift measures unexpected layout movement. Lower CLS means the page is visually stable.
Question: What is INP?
Interaction to Next Paint measures how quickly the page responds visually after user interactions.
Question: Why can Lighthouse and real user data be different?
Lighthouse is lab data from a controlled test. Real user data depends on actual devices, networks, locations, browsers, and user behavior.
6. Additional Topics Senior Frontend Engineers Should Know
Your original list is strong, but senior-level frontend performance engineering usually also includes the following topics.
Image Optimization
Images are often the largest assets on a page.
Best practices:
- Use modern formats like AVIF and WebP.
- Use responsive images with srcset and sizes.
- Set width and height to prevent CLS.
- Compress images.
- Lazy load below-the-fold images.
- Prioritize the hero image.
Example:
<img src="/product-800.webp" srcset="/product-400.webp 400w, /product-800.webp 800w, /product-1200.webp 1200w" sizes="(max-width: 600px) 400px, 800px" width="800" height="600" loading="lazy" alt="Product" />Font Optimization
Fonts can block rendering or cause layout shifts.
Best practices:
- Use fewer font families and weights.
- Use font-display: swap or another suitable strategy.
- Preload critical fonts.
- Use WOFF2.
- Consider system fonts for performance-critical apps.
CSS Performance
CSS performance problems include:
- Too much unused CSS.
- Render-blocking stylesheets.
- Complex selectors in huge documents.
- Layout thrashing caused by JavaScript and style reads/writes.
- Animating layout properties.
Best practices:
- Remove unused CSS.
- Load critical CSS early.
- Avoid huge global stylesheets.
- Prefer transform and opacity for animation.
- Keep CSS architecture maintainable.
Third-Party Scripts
Third-party scripts can seriously damage performance.
Examples:
- Analytics.
- Ads.
- Chat widgets.
- A/B testing tools.
- Tag managers.
Control them by:
- Auditing necessity.
- Loading after critical content.
- Using async or defer.
- Delaying non-critical widgets.
- Monitoring their main-thread cost.
- Removing unused tags.
JavaScript Main Thread And Long Tasks
The main thread handles JavaScript, style, layout, paint, and user input. If JavaScript blocks the main thread, the UI becomes unresponsive.
A long task is usually a task longer than 50 ms.
Ways to reduce long tasks:
- Split work into smaller chunks.
- Use Web Workers for CPU-heavy work.
- Reduce bundle size.
- Avoid expensive synchronous loops.
- Use virtualization.
- Defer non-critical work.
Web Workers
Web Workers run JavaScript on a background thread.
Use them for:
- Data parsing.
- Large calculations.
- Search indexing.
- Image processing.
- Compression.
Do not use them for direct DOM access. Workers cannot directly manipulate the DOM.
SSR, SSG, ISR, And Hydration Performance
Rendering strategy affects performance.
SSR:
- Server renders HTML per request.
- Good for dynamic SEO content.
- Can improve initial content visibility.
- Can increase server cost and TTFB if not optimized.
SSG:
- HTML is generated at build time.
- Very fast when cached on CDN.
- Best for mostly static pages.
ISR:
- Static pages are regenerated after a time interval or trigger.
- Useful for content that changes occasionally.
Hydration:
- React attaches interactivity to server-rendered HTML.
- Large hydration work can block the main thread.
- Reducing client components and JavaScript can improve hydration performance.
Performance Budgets
A performance budget defines limits.
Examples:
- Initial JavaScript <= 170 KB gzip.
- LCP <= 2.5 seconds.
- CLS <= 0.1.
- INP <= 200 ms.
- Total image weight <= 1 MB.
- No single third-party script over a defined cost.
Budgets help teams prevent regressions.
RUM vs Synthetic Monitoring
Synthetic monitoring tests performance in controlled environments.
RUM, or Real User Monitoring, measures actual users.
Use both:
- Synthetic monitoring helps catch regressions before release.
- RUM shows what real users experience in production.
Interview Questions And Answers: Additional Topics
Question: Why are images important for frontend performance?
Images are often the largest page assets and can directly affect LCP, bandwidth usage, and CLS if dimensions are missing.
Question: How can fonts hurt performance?
Fonts can block text rendering, cause invisible text, or create layout shifts when the final font replaces a fallback font.
Question: Why are third-party scripts risky?
They can block the main thread, delay rendering, make network requests, cause layout shifts, and are often outside the direct control of the application team.
Question: What is a performance budget?
A performance budget is a defined limit for metrics like bundle size, LCP, INP, or image weight. It helps prevent performance regressions.
Question: What is the difference between RUM and synthetic monitoring?
RUM measures real users in production. Synthetic monitoring measures controlled test runs in predefined environments.
7. Frontend Performance Engineering Workflow
A senior frontend engineer does not randomly optimize. The correct workflow is systematic.
Step 1: Measure
Use tools:
- Chrome DevTools Performance panel.
- React DevTools Profiler.
- Lighthouse.
- WebPageTest.
- Bundle analyzer.
- Memory profiler.
- Real User Monitoring.
Step 2: Identify The Bottleneck
Ask:
- Is this a network issue?
- Is JavaScript blocking the main thread?
- Is rendering too expensive?
- Is memory growing over time?
- Is the server response slow?
- Is a third-party script causing the problem?
Step 3: Prioritize By User Impact
Fix the issues that affect users most.
Example priority:
- Poor LCP on landing page.
- Bad INP on checkout.
- Huge JavaScript on mobile.
- Memory leak in long-running dashboard.
- CLS from ads.
Step 4: Apply The Smallest Correct Fix
Examples:
- Compress one hero image.
- Split one heavy route.
- Remove one unused dependency.
- Add cleanup to one effect.
- Virtualize one large table.
Step 5: Verify
After fixing, measure again.
Do not assume performance improved. Prove it.
Step 6: Monitor In Production
Performance can regress. Monitor continuously.
Track:
- Core Web Vitals.
- Bundle size.
- Error rates.
- API latency.
- Long tasks.
- Third-party script impact.
8. Senior-Level Interview Scenarios
Scenario 1: The React app is slow when typing in a search box. What do you do?
Answer:
First, profile the interaction using React DevTools and Chrome Performance panel. Check if typing updates a large list or expensive component. Keep the input state urgent and defer expensive filtering using startTransition or useDeferredValue. If the list is large, use virtualization. If filtering is CPU-heavy, debounce, move filtering server-side, or use a Web Worker. Avoid adding useMemo or useCallback blindly unless profiling proves they solve the issue.
Scenario 2: Lighthouse shows poor LCP. How do you debug it?
Answer:
Identify the LCP element in DevTools or Lighthouse. Check if it is an image, text block, or hero section. Then inspect TTFB, render-blocking resources, image size, preload behavior, font loading, and JavaScript blocking. Optimize the LCP resource, reduce server delay, avoid lazy loading the hero image, and reduce critical-path JavaScript and CSS.
Scenario 3: The app becomes slower after users keep it open for one hour. What could be wrong?
Answer:
This may be a memory leak or accumulating background work. Check timers, event listeners, WebSocket subscriptions, caches, detached DOM nodes, and repeated polling. Use Chrome Memory tools and heap snapshots to compare memory before and after repeated actions.
Scenario 4: Bundle size suddenly increased. What do you check?
Answer:
Run a production bundle analysis. Check new dependencies, duplicate packages, changed imports, accidental full-library imports, polyfills, and route chunks. Compare against previous bundle reports and enforce a performance budget in CI.
Scenario 5: A dashboard table with 20,000 rows is slow. What is the solution?
Answer:
Do not render all rows. Use virtualization or pagination. Reduce expensive cell rendering, avoid unnecessary state updates, and make filtering/sorting efficient. If computation is heavy, move it to the server or a Web Worker.
9. Production Performance Checklist
Bundle
- Production bundle analyzed.
- Unused dependencies removed.
- Large routes split.
- Heavy components lazy loaded.
- Modern ESM imports used.
- Bundle budget enforced.
Rendering
- Large lists virtualized.
- Expensive re-renders profiled.
- State placed close to usage.
- Context updates controlled.
- Animations use transform and opacity.
- React 19 compiler-friendly code used when available.
Memory
- Effects clean up timers and listeners.
- Requests cancelled when unnecessary.
- Subscriptions removed on unmount.
- Detached DOM nodes checked.
- Long-running sessions tested.
Network
- Text assets compressed.
- Static assets served from CDN.
- Cache headers configured.
- Critical assets preloaded.
- Future route assets prefetched carefully.
- API waterfalls reduced.
Core Web Vitals
- LCP element optimized.
- CLS sources fixed.
- INP issues profiled.
- TTFB monitored.
- Field data collected.
- Mobile performance tested.
Final Advice
Frontend performance engineering is not about memorizing tools. It is about understanding the browser, measuring real bottlenecks, making focused improvements, and preventing regressions.
For interviews, you should be able to explain:
- What the metric or technique means.
- Why it matters.
- When to use it.
- When not to use it.
- How to measure it.
- How to improve it in a real application.
For real work, remember this rule:
Measure first. Optimize the bottleneck. Verify the result. Monitor production.